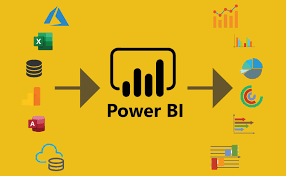
Welcome to the advanced guide on leveraging the full potential of Microsoft Power BI. In this article, we will explore some of the most powerful features and techniques that will take your data analysis and visualization to the next level.
1. Data Modeling and TransformationBefore you start creating stunning visualizations, it's crucial to have a well-structured and clean dataset. Learn how to use Power Query to transform and shape your data for optimal analysis.
2. Advanced VisualizationsDiscover advanced chart types, custom visuals, and tips for creating interactive dashboards that tell compelling data stories. Unleash the true potential of your data with creative visualizations.
3. DAX Formulas and CalculationsMaster Data Analysis Expressions (DAX) to create complex calculations and measures. We'll delve into DAX functions and techniques for solving real-world data challenges.
4. Data Security and SharingLearn best practices for securing your Power BI reports and sharing them with colleagues or clients while maintaining data integrity. We'll explore row-level security and sharing options.
5. Performance OptimizationOptimize your Power BI reports for speed and efficiency. We'll discuss techniques for improving report performance, including data modeling and query optimization.


